Go to NCAR homepage Go to NCAR homepage
NCAR HomeRAL HomeWeather HomeSatelliteRadarSurfaceUpper-AirForecasts
Help for this page     advanced  
Winds/Temps at pressures:
rawinsonde plot at    925 mb    850 mb    700 mb    500 mb    300 mb    250 mb    200 mb
including contours    925 mb    850 mb    700 mb    500 mb    300 mb    250 mb    200 mb
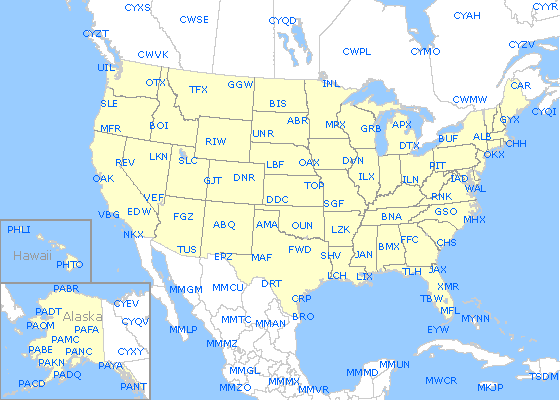
Skew-T/Log-P diagrams created from rawinsonde data
rawinsonde sites
End date: 
End time: 
Loop duration: 
Upper-Air plots from other internet sources


SkewT/LogP charts
Univ of Wyoming

 
Home >  RAL >  Weather :  Satellite  |  Radar  |  Surface  |  Upper-Air  |  Forecast  |  News  |  Help Pages
 
© 1994-2024  |   Privacy Policy  |   Cookies  |   Accessibility  |   Terms of Use  |   Copyright issues  |   Contact us  |   Sponsored by
This material is based upon work supported by the NSF National Center for Atmospheric Research,
which is a major facility sponsored by the National Science Foundation under Cooperative Agreement No. 1852977,
and managed by the University Corporation for Atmospheric Research.
Any opinions, findings and conclusions or recommendations expressed in this material do not necessarily reflect the views of the National Science Foundation.